What is the Query Store?
A SQL Server 2016 (and SQL DB) Feature that can be Enabled
- Provides insight on query plan choice and performance
- Simplifies performance troubleshooting by quickly finding performance differences caused by query plan changes
- Automatically captures a history of queries, plans, and runtime statistics, and retains these for review
- Separates data by time windows to better illustrate database usage patterns and understand when query plan changes happened on the server
Why Use the Query Store?

Keeping performance high, and costs low

How the Query Store “Works”
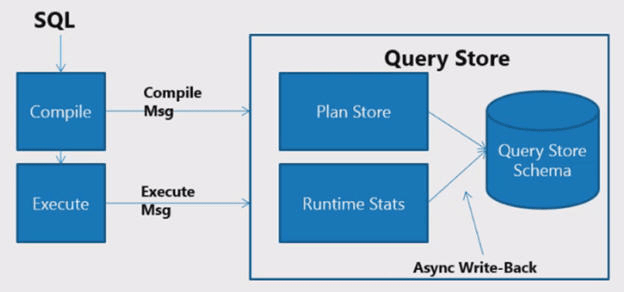
- A SQL statement is executed
- The statement is compiled
- A compilation message is generated
- The statement is executed
- An execution message is generated
- Both messages are sent to the Query Store
- The Plan Store stores the execution plans
- The Runtime Stats are collected
- The Query Store Schema is updated with all information
- The Write-Back is asynchronous, which reduces latency
Does It Work with In-Memory OLTP?

- SQL Server Query Store allows you to monitor the performance of natively compiled code for workloads running in-memory OLTP
- Compile and runtime statistics are collected and exposed the same way as for disk-based workloads
- When you migrate to in-memory OLTP you can continue using Query Store views in SQL Server Management Studio (SSMS) as well as custom scripts you have developed for disk-based workloads before migration
- This saves your investment in learning Query Store technology and makes it generally usable for troubleshooting all type of workloads
How to Use the Query Store
In Just 3 Easy Steps, You TOO can be a DBA!!

- Enable the Query Store
- Let the Query Store Collect the Data
- Pinpoint and fix “problematic” queries
Admittedly, the last step requires a bit more expertise and effort.
Setting up the Query Store
There are primarily 2 ways to accomplish this.
- Using the Query Store page in SSMS
In Object Explorer, right-click a database, and then click Properties

In the Database Properties dialog box, select the Query Store page
Select related attributes
- General
- Operation Mode (Read or Read/Write)
- Monitoring
- Data Flush Interval (Manual Entry in Minutes)
- Statistics Collection (5 mins, 10 mins, 15 mins, 30 mins, 1 hr, 1 day)
- Max Size
- Query Store Capture Mode (All or Auto)
- Size Based Cleanup Mode (Off or Auto)
- Stale Query Threshold (Manual Entry in Days)

- By Using T-SQL Statements
Use the ALTER DATABASE statement
ALTER DATABASE AdventureWorksDW2016CTP3
SET QUERY_STORE = ON;

Query Store Options with T-SQL

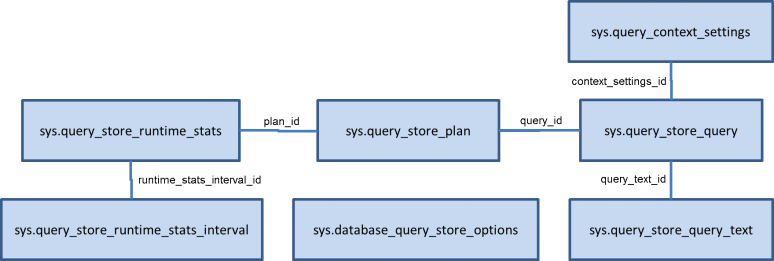
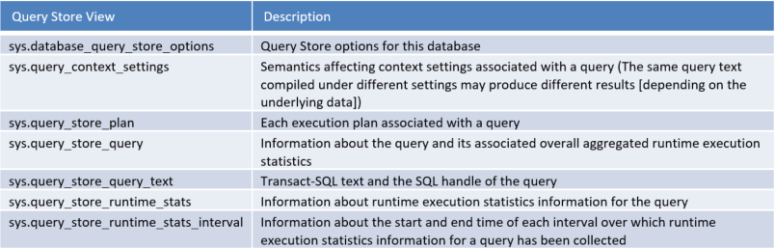
What Information Does the Query Store Provide?
Everything in the following data model:
Query Store Best Practices
- Information and performance are generally a give and take, but there ARE some best practices
- Every single setting in the Query Store has associated costs and benefits
- Treat Query Store performance tuning like an agile project with Sprints
- Sprint 1 – Keep Operation Mode in READ/WRITE mode for information collection
- This reduces write time, and subsequent overall database performance, for data collection as no reporting is occurring
- Sprint 2 – Change Operation Mode to READ mode for analysis and actual performance tuning
- This increases report performance because no writes are occurring. This also results in no “dirty reads” because of the asynchronous writes
- Sprint 1 – Keep Operation Mode in READ/WRITE mode for information collection
- Information and performance are generally a give and take, and it ultimately relies on each and every business and its processes
- Flush the data at specific business case intervals. For example, if performance of the DB seems to be poor around end of the month due financial reporting, consider using the Agile methodology to complete one iteration, then flush the data before the next iteration.
- Keep the Max Size small enough to keep the reporting relatively snappy, however, keep enough data to capture all of the business needs
- Keep an accurate Cleanup Policy as the business and reporting solution evolves
- Collect statistics as frequently as possible to see exactly which execution plans are being executed. If the statistics are not updated for some time, you may be looking at an old execution plan because the statistics have changed
Query Store Reporting
For Azure SQL DB
Quick Performance Insight
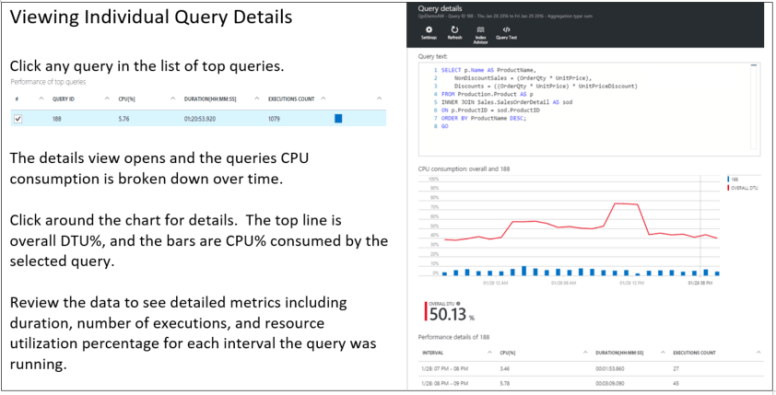
The top queries view opens and the top CPU consuming queries are listed
- The top line shows overall DTU% for the database, while the bars show CPU% consumed by the selected queries during the selected interval
- The bottom grid represents aggregated information for the visible queries
- Average CPU per query during observable interval
- Total duration per query
- Total number of executions for a particular query

On Premise Solution
Use SQL Server Management Studio (SSMS)

Query Store Dashboards

Custom Views and SQL
Leverage the data model
Query Store Administration with T-SQL
Utilize the Query Store stored procedures

Forcing Execution Plans
Old Way

New Way

Error State
- Remember to verify intermittently that the Query Store is still collecting data
SELECT actual_state_desc, desired_state_desc, current_storage_size_mb, max_storage_size_mb, readonly_reason, interval_length_minutes, stale_query_threshold_days, size_based_cleanup_mode_desc, query_capture_mode_desc
FROM sys.database_query_store_options;
If there is a difference between the actual_state_desc and desired_state_desc, this indicates that a change of operations mode occurred automatically.
The most common change is for the Query Store to silently switch to read-only mode. In extremely rarely circumstances, Query Store can end up in the ERROR state because of internal errors.
When the actual state is read-only, use the readonly_reason column to determine the root cause. Typically, the Query Store transitioned to read-only mode because the size quota was exceeded. In that case the readonly_reason is set to 65536.
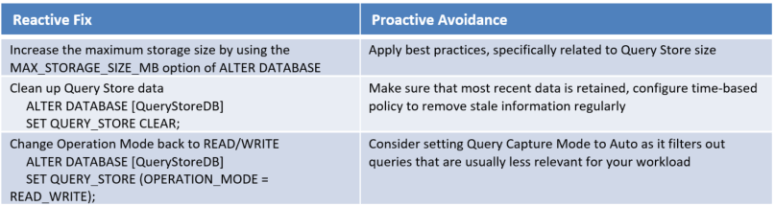
How to Fix Error State
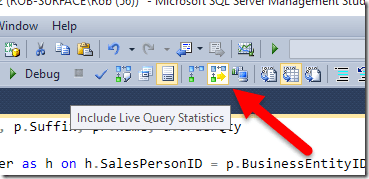
Live Query Statistics
This is a new feature of SSMS 2016. Even if your organization chooses not to upgrade to 2016, this is still an option with 2014 SP1.
This feature provides the ability to view the live execution plan of an active query. This live query plan provides real-time insights into the query execution process as the controls flow from one query plan operator to another. The live query plan displays the overall query progress and operator-level run-time execution statistics such as the number of rows produced, elapsed time, operator progress, etc. Because this data is available in real time without needing to wait for the query to complete, these execution statistics are extremely useful for debugging query performance issues.